


What is the risk-return of Sustainable Development Investments?
What is the risk-return trade-off for Sustainable Development Investments, as defined by the SDI-AOP taxonomy? And what are the considerations which asset managers and asset owners should be aware of when constructing SDI portfolios? Preliminary research conducted by Michael W.D. Kurz, Ph.D. Senior Advisor Responsible Investments at PGGM, provides some interesting insights into a sustainable investment approach, using the data and classifications from the SDI-AOP methodology. Kurz presented his findings during the SDI Asset Owner Platform seminar in March 2022.
"I like the SDI data because it focusses on companies’ exposure to Sustainable Development Goals through revenues from products and services related to SDGs," says Michael Kurz. "This is an interesting view from an investment perspective because it ensures that we look at SDG-alignment through the lens of companies’ business models and core business activities. The SDGs are where the companies are making their money, they are selling products which support one or more of the SDGs."
An objective metric
Not all United Nations SDGs (which of course were never designed for investors) are equally investible according to the SDI-AOP method. This method focusses specifically on SDG-aligned financial metrics, most often revenues. This restraint allows for 12 of the 17 SDGs to form a basis for the SDI dataset. The remaining five SDGs require contributions through operations and conduct. The SDI AOP method is therefore not ESG-focussed, and can be considered objective in terms of financial metrics as it is founded on rules-based classification and auditable data. ESG factors are out of scope unless they could potentially undo the positive contribution. This may result in an 'ESG warning flag' which does not affect their SDI-AOP classification.
In order to conduct comparative research, Kurz needed a robust method to identify SDIs, based on the SDI-AOP taxonomy. In essence, the taxonomy takes an SDG, divides it into investible sub-goals which in turn can be split into product categories, and then companies’ products and services. The taxonomy is the foundation of mapping of investments to the SDGs.
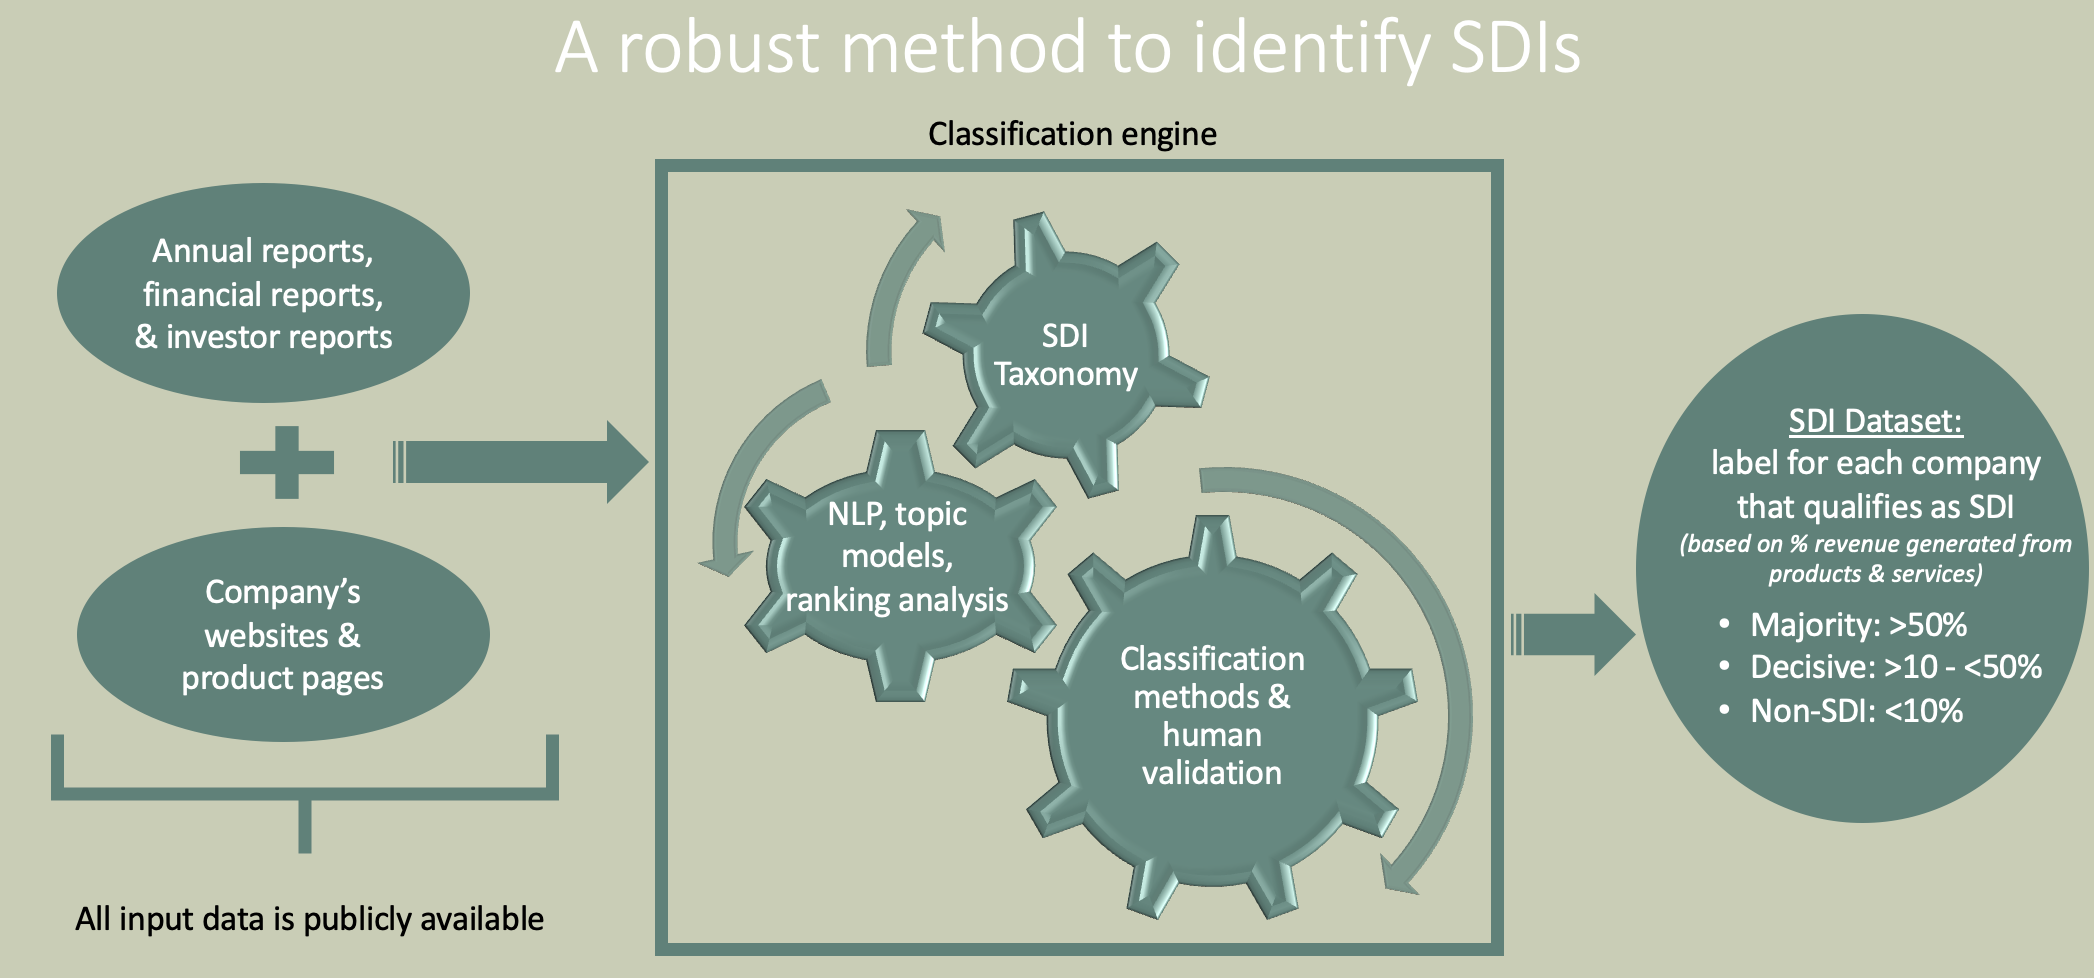
This taxonomy is then fed into a 'classification engine'. "The methodology is based on machine learning using large amounts of publicly-available data and includes human validation," explains Kurz. "What we get in the end is one of three labels for each company covered in the SDI AOP dataset: Majority, Decisive, or Non-SDI." The difference between Majority and Decisive SDI depends on the level of contribution which the company makes to one or more SDGs in terms of its products and services. Non-SDI speaks for itself.
Data from 6,487 companies
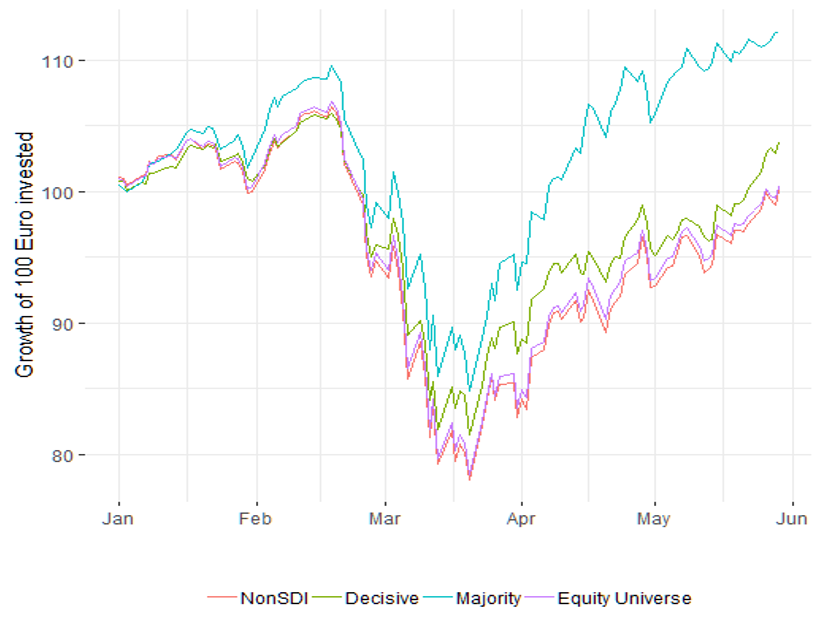
Kurz based his research on data from 6,487 companies in total. Of those, 5,334 were non-SDI; 666 were Decisive, and 875 were labelled Majority - the best rating in terms of SDG alignment. He then set up a series of four market-capitalisation weighted portfolios: Majority, Decisive, Non-SDI and Equity Universe and simulated an investment of €100 in each portfolio and plotted the results over time.
"All the companies are rather large: with an average market capitalisation of around €4.5 billion," says Kurz. "This is approximately the same average market cap as companies on the US stock market. In terms of an international comparison, these are relatively big companies." He added that these were also relatively old companies in terms of years since incorporation.
Younger and more specialized
"I found it interesting to see that the Majority SDIs are on average slightly younger than the rest." Average age since incorporation was 32 years for Majority, 48 for Decisive and 37 for Non-SDIs. "And quite important for portfolio construction, there's a big range of countries and industries under each label. Even in terms of the Decisive portfolio which is the smallest in terms of numbers, we still have 48 different countries and 48 different industries," he says.
Kurz tracked his four portfolios from 2019, when the first SDI-AOP classification was released. He then extrapolated them backwards to 2015 and followed them forward to the end of 2021. "One very interesting pattern here is that Decisive SDIs underperform both compared to the Majority SDIs, but also compared to the non-SDIs. This suggests that for companies, for their investment performance, it pays to specialize. The performance is better for those companies which strongly commit to the SDGs: those which really derive between 80 and 100% of their revenues from SDG-related activities."
A notable market event
One major notable market event provided interesting data for Kurz during his research. The COVID-19 related market downturn between March and April 2020. "It is interesting to see what happened specifically during the 2020 market plunge," says Kurz. "At first, like everything else, SDIs collapsed with the rest of the market, but they didn't collapse quite as steeply, and I think most importantly they recovered faster. They regained their pre-crash values a good month faster than the rest of the market."
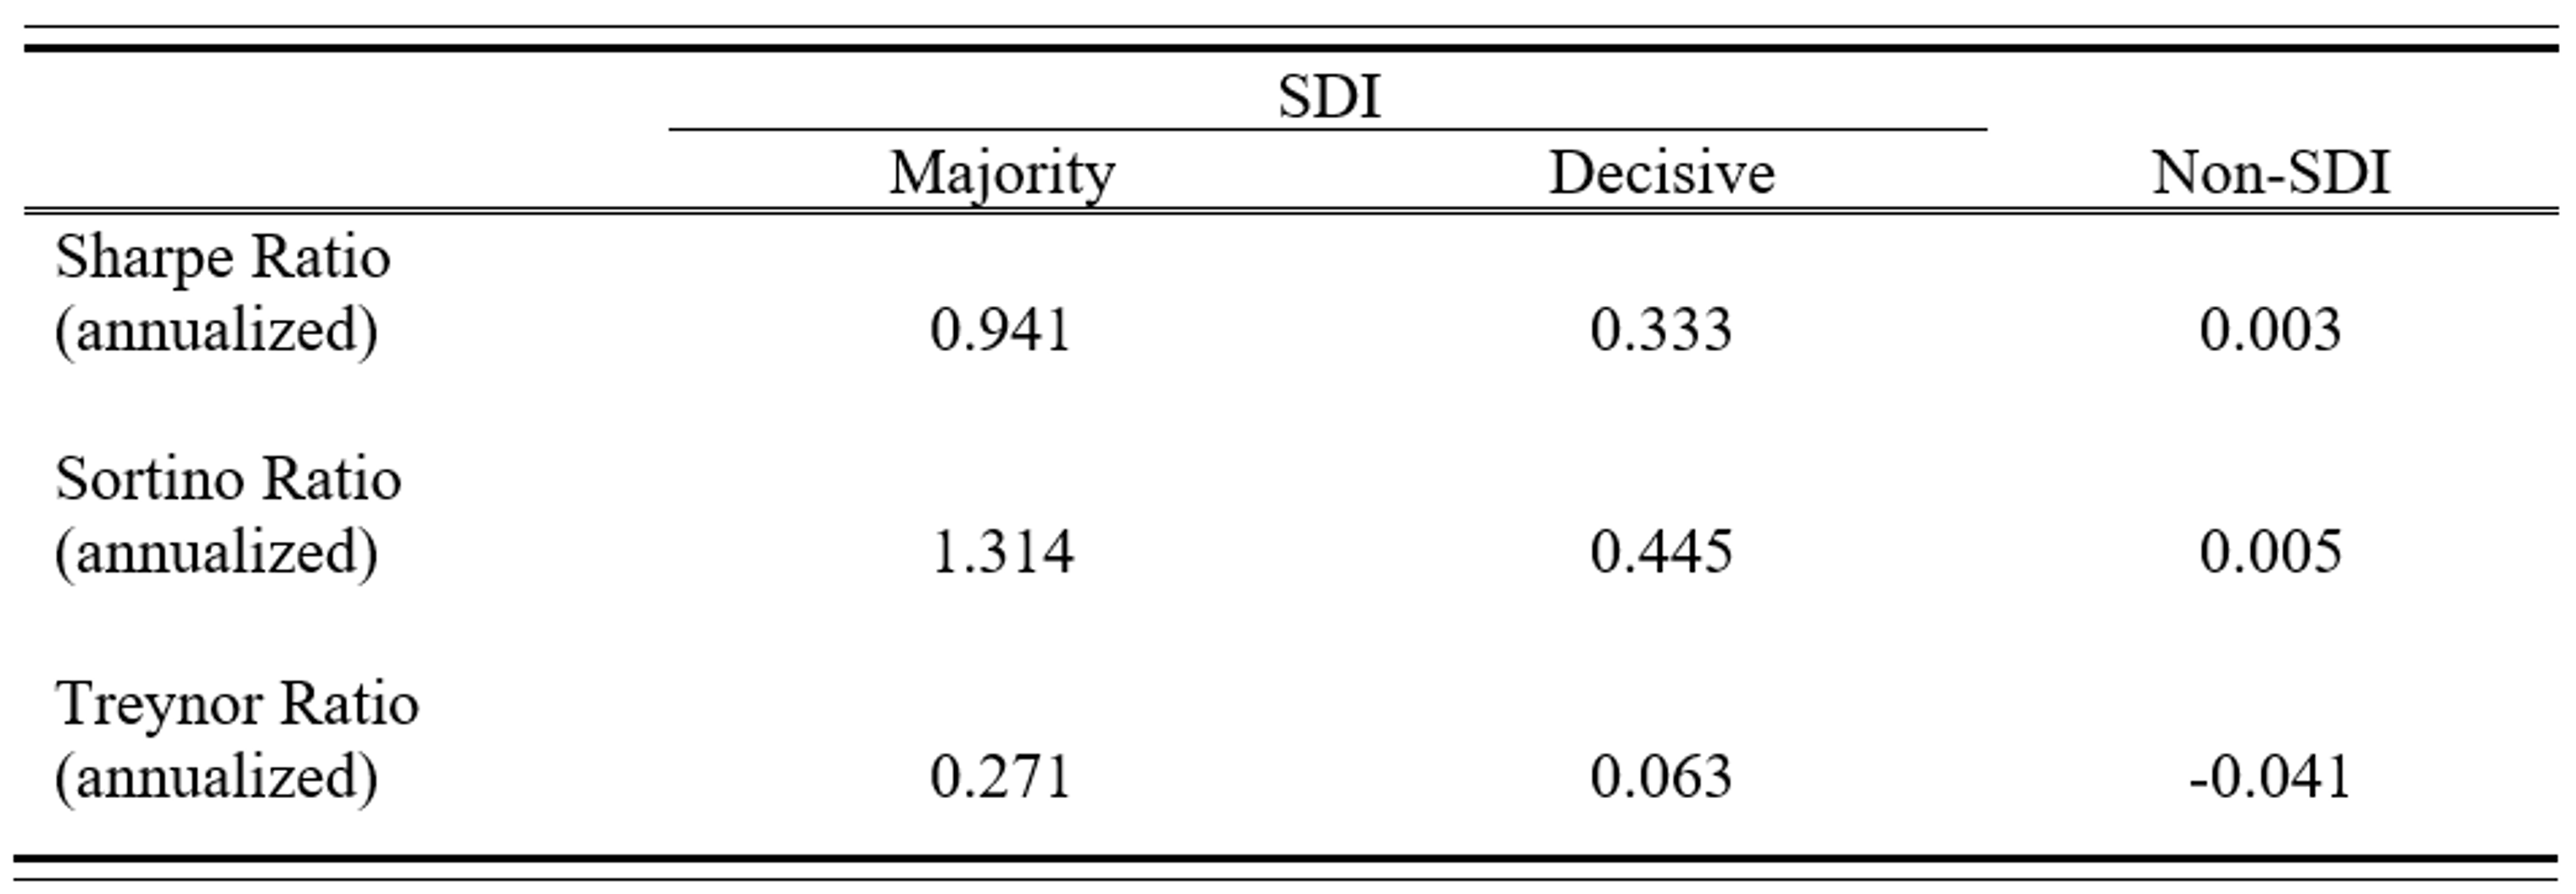
The research showed that SDI-Majority companies offer higher compensation for risk across three dimensions of investment risk: total volatility (Sharpe Ratio), downside volatility (Sortino Ratio) and systematic risk (Treynor Ratio). "The Majority SDIs performed relatively better and they seem to offer a good compensation for downside risk in particular," Kurz added. "However, it should be noted that the year 2020 was not the most representative sample period, so time will tell how robust these results are going forward."
Pure-play SDIs
The main conclusions of Kurz's preliminary research is that SDIs provide an attractive risk-return trade-off: "A pure-play SDI portfolio yields a risk-adjusted performance that is comparable to the performance of a broad market index," he says. One aspect to be aware of is exposure to specific SDGs. Kurz notes, for example, that both Majority and Decisive SDIs were heavily exposed to SDG3: Health and well-being. "And this, of course, has an impact on the industry composition of the portfolios as some industries are closer to some SDGs than others," he adds. Therefore, another of his conclusions was that when constructing an SDI portfolio, attention to industry exposure must be paid to avoid tilting too heavily into certain sectors.