


Frequently Asked Questions
General
What is a Sustainable Development Investment?
A Sustainable Development Investment (SDI) is a company, which according to our methodology contributes positively to the UN Sustainable Development Goals through its products and services. For those SDGs where companies’ contributions stem first and foremost from their operations or conduct (rather than products and services) users may develop SDG-specific indicators and references to capture these contributions by so-called Acknowledged Transformational Leaders (ATLs). As of 1st August 2022, the SDI AOP now separately measures negative contributions, which looks at the products/services that are not considered consistent with achieving the UN SDGs.
What is the Sustainable Development Investments Asset Owner Platform (SDI AOP)?
Over the past years APG and PGGM have invested substantial resources into defining and measuring Sustainable Development Investments (SDIs). In September of 2019 APG and PGGM announced their intention to establish an Asset Owner Platform (AOP). In 2020 British Colombia Investment Management Corporation and Australian Super joined the SDI AOP.
Through the Asset Owner Platform, we help to accelerate investments to deliver on the Sustainable Development Goals and thereby support investment outcomes for end beneficiaries. As asset owners, we are creating a community of investors who are jointly advancing the SDI AOP standard for investing into the UN Sustainable Development Goals (SDGs). The SDI AOP aspires to drive innovation in the investment industry with the SDI standard being made available to all market participants.
The Design Authority (DA) is the decision-making authority within the SDI AOP and is responsible for the development and maintenance of the SDI taxonomy and guidance, as well ass the SDI definitions and classification methodology.
Entis is the technology provider responsible for the translation of the taxonomy, guidance and rules into an SDI classification making use of structured and unstructured data. Artificial intelligence and machine learning, combined with human validation, provide scale and continuous improvement to the SDI dataset of 10055 companies.
ISS STOXX is the global financial services company that is the distributor of the SDI data. ISS STOXX ensures that the SDI classifications are delivered to all subscribers at the same time. They also act as a first line of support as and are responsible for all commercial aspects of the product.
What are the products and services of the SDI AOP?
Across the globe, we are witnessing an increasing appetite for investing in the UN Sustainable Development Goals (SDGs). The availability of high-quality data to identify company contributions to the SDGs is a decisive factor in being able to implement Sustainable Development Investments (SDIs).
The SDI AOP makes the SDI AOP taxonomy, resulting data and insights available to its subscribers. The SDI AOP currently offers two datasets, the SDI Classification and the SDI Innovation Outlook and continues to grow product offering built of the SDI taxonomy as a reference point. In addition to the datasets an SDI Private Markets Membership is offered.
SDI Classification
This is in the form of a company assessment of whether it can be classified as an SDI primarily based on its products and services. The SDI Classification assesses the size of the contribution with the SDG’s based on the SDI taxonomy and guidance and includes a short rationale as well as an indication of the level of confidence in the data underlying the assessment.
SDI Innovation Outlook
The SDI Innovation Outlook provides subscribers with insights into which companies are actively developing the future solutions needed to help achieve the SDGs. The SDI Innovation Outlook quantifies and describes the alignment of a company’s patent portfolio with the SDGs.
SDI Private Markets Membership
The SDI Private Markets Membership offers a tool and templates to guide members to classify their private market investments robustly and consistent with the public market classification approach. Members can upload their portfolios to the optional SDI Dashboard to enable SDI screening, benchmarking, optimization, asset allocation and performance attribution.
The SDI Classification and SDI Innovation Outlook is distributed by our ISS STOXX (mail to: sdiaop@iss-stoxx.com. For the Private Markets membership reach out to info@sdi-aop.org.
The SDI AOP will continuously improve the standard and the data and maintain a dynamic research agenda.
How does he SDI standard differs from other products in the market?
The Asset Owner Platform is established and backed by leading asset owners, providing a unique business model in the market for the specific SDG-related research. We believe that a common asset owner-led initiative improves credibility through SDI standardization and brings efficiencies in implementation. The rules-based approach based in deploying financial data and utilizing AI results in a consistent, systematic and efficient application of the methodology. Furthermore, the SDI standard allows for a high degree of transparency by providing clear references to the underlying data. In the future the SDI standard will be further enhanced by the inclusion of forward-looking metrics and a measurable outcomes dimension.
What is the relation of the SDI AOP taxonomy to the EU and other taxonomies?
The SDI taxonomy is an asset owner interpretation of the SDGs. It is a taxonomy developed for immediate use by investors and based on available data and information. It differs from the EU taxonomy in scope (global SDGs, not just European climate) and entry point (corporate revenues rather than economic activity). At the same time, the SDI taxonomy and the EU taxonomy connect at the level of objectives (for climate mitigation and adaptation) as well as the use of thresholds and conditions. While developing the SDI standard we will use the EU and other taxonomies as a reference to inform our efforts.
Are all the 17 SDGs and sub-goals in scope of the SDI AOP assessment?
The taxonomy covers the full range of SDGs from a capital markets perspective. The SDI classification is applied primarily to those SDGs that are considered investible from a product or services perspective. Users may decide to overlay information for SDGs where companies’ specific contribution (for example to SDG5, Gender equality) is operational in nature. SDG 16 (Peace & justice) and 17 (Partnerships) are presently considered out of scope, being the responsibility of governments, or otherwise non-investible.
Coverage of SDG1 (No Poverty) was added in 2022 to cover the contribution of development finance to achieving SDGs.
Of the 17 SDGs, only five are not in scope as they are focused on governments and institutions or can only be achieved through conduct, for which no clear products can be related.
SDG’s not included are:
• SDG 5: Gender equality
• SDG 8: Decent economic growth
• SDG 10: Reduced inequalities
• SDG 16: Peace, justice and strong institution
• SDG 17: Partnership for the goals.
What is the governance of the research process within the SDI AOP?
DA members designate an authorized representative—such as the Responsible Investment Officer or another officer with similar responsibilities—to represent them in DA meetings related to research. Together with our independent research director, James Leaton, these representatives form a Research Committee. This committee is responsible for overseeing the quality of the SDI taxonomy and guidance, as well as the rules and methodology for determining whether companies are decisive or majority players. Their work forms the foundation for the Data & Technology provider, Entis, to generate SDI data and reports.
The Research Committee approves amendments to these documents. The Committee further determines the research priorities based on emerging issues and input from the SDI investor community, and takes decisions regarding research outcomes on the advice from the topic owners. The Research Committee is responsible for assigning topic owners.
The Data & Technology provider (Entis) implements the rules and provides the classifications to the global distribution partner (ISS STOXX) which makes the SDI classifications available to the market to all subscribers at the same time.
Who are the owners of the Design Authority?
At launch (2020), the Design Authority BV consists of four equal shareholders, APG, PGGM, British Colombia Investment Management Corporation and Australian Super. The intention is to grow the number of shareholders to a maximum of 5-7 (each with an equal share).
Methodology
What is the process to update the Taxonomy & Guidance, Rules & Methodology?
The DA is responsible for maintenance and updating of the Taxonomy & Guidance as well as Rules & Methodology documents. The DA members will mandate an authorized representative, e.g. the respective Responsible Investment officer or an officer with a similar responsibility within the asset owner organization to represent the asset owners in the DA meetings involving research. These individuals together with the research director will form a Research Committee, which is responsible for the quality of the SDI Taxonomy & Guidance as well as the Rules and the Methodology of which companies are considered decisive players or majority players; all which provide the basis for the Data and Technology provider (Entis) to generate SDI data and reports. The Research Committee of the DA approves amendments to these documents. The Committee further determines the research priorities based on the research backlog and takes decisions regarding new research outcomes.
Which data sources are used in the company assessments?
The assessment of a company is solely based on publicly available information, more specifically: annual reports, financial reports, investor presentations on company’s websites, and product pages. By using publicly available information and being transparent in the SDI contribution calculation, the method allows users to verify and communicate the results.
Is the focus on the 'what' or the 'how'?
For the SDI AOP, the primary focus is on companies’ contribution to the SDGs through their products and services (the ‘what’), whereas for ESG is typically focused on conduct (the ‘how’). For example: making solar panels (SDI) versus having operational policies, management systems, targets and disclosure in place (ESG).
Their ESG performance (the ‘how’) is only considered if instilling critical attributes of the final product or service, for example, FSC-certified biomass. There are some warning flags that relate to ESG, such as predatory lending, that highlighting potentially harmful operations.
How many products and services are considered as solutions in the SDI methodology?
Currently, we distinguish hundreds of different products, of which roughly half qualify as SDI products. Those products are grouped into 100 product categories and are reported in the SDI datasets.
The products are identified using a semantic modelling algorithm, to ensure not relevant products are not captured. For example, the product category Clean Water – Wastewater Treatment includes inter alia chemicals used for water treatment, water/sludge/sewage treatment systems, water purification, reverse osmosis water purification, and construction of wastewater treatment plants. Product categories as well as the products belonging to product categories are updated annually by running the algorithm on the continuously updated text database containing annual reports, patents, and product pages of companies.
How transparent is the methodology? Can it be reconstructed? Is it auditable?
We consider the transparency of the SDI assessment as one of unique selling points of the SDI AOP. For every company, the inputs and the rules applied are provided, and data sources referenced. The rationale behind the SDI status (Majority or Decisive or Non-SDI) is documented too. As a relatively new dataset, the SDI assessment process by Entis is continuously being refined and SDI data has not been externally audited yet. However, the effort and systems are designed for just that, in due time.
How does the SDI AOP methodology differ from some of the other SDG solutions in the market?
The focus of the SDI AOP approach is on identifying products and services which contribute to the SDGs, evidenced by the associated revenues. This means that financial reporting is the basis of the analysis. This differs from other approaches which use more traditional ESG disclosures as the basis for assessing corporate behaviour, or media coverage for flagging negative issues. As a result, SDI AOP methodology assumes lower risk of bias due to the size / region of the entity impacting the level of disclosure/coverage. To put it another way, SDI AOP is focused on the fundamental nature of the business, rather than how it says it conducts itself.
What are the key elements in the methodology to identify SDIs?
The vast majority of companies are classified as SDI on the basis of the share of revenues they derive from products and services that contribute to the SDGs. In some industries however we use other financial metrics to determine that contribution. For example, electric utility companies are assessed using the installed capacity in renewables in megawatt (MW) and for telcos we use geographical revenue, ruralness and capex.
Is there a breakdown of revenues per SDG?
In addition to the total sum of SDI revenue per SDG, a breakdown of SDI revenues and revenue percentage, per SDG and per company is provided. This enables users to align their investment process to specific SDGs as well as deliver enhanced exposure reports based on the individual SDGs.
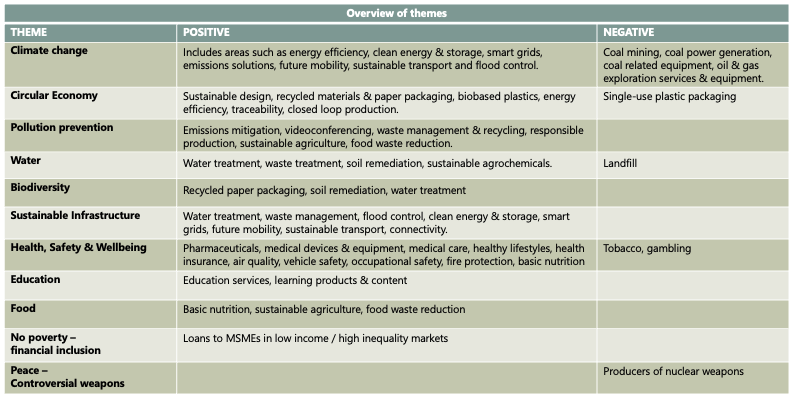
What is thematic tagging and how does it work?
The theme allocation is a logical approach based on what the patent technology is. For example, since we are looking at direct contributions, we would not categorize climate-related products as “biodiversity” due to an indirect benefit to biodiversity of tackling climate change. This is consistent with how we allocate SDGs where we focus on the primary one rather than ending up with a very complex web of overlapping designations. The DA found it more useful to be able to draw out main SDGs/themes than end up with most things qualifying for multiple SDGs/themes.
In terms of the relationship between themes and SDGs, sometimes there is a strong overlap with an SDG, such as Health for SDG3. Since the climate-related technologies can be spread across quite a few SDGs an SDG does not determine the theme.
The theme allocation was developed and approved by the research committee which consists of members of the responsible investment (RI) teams of the 4 Design Authority asset owners.
Revenues are segmented to each product category so there are indeed companies which have products contributing to different SDGs. Themes are allocated at the product category level, so companies can contribute to multiple themes – it is not the company that is given a primary theme.
Does the SDI standard only look at positive contributions?
As of 1st August 2022, the SDI AOP also considers the negative contributions to the SDGs in a similar way it classifies SDI entities. The process is rule-based and auditable. Furthermore, focusing on products & services and financial data, the process is also fact-based and allows for transparency. The SDI AOP dataset includes the negative contributions separately from the positive contributions, as we feel that the ‘netting’ of positive and negative contributions would require various assumptions and value judgments, thereby introducing subjective considerations into the process at the possible expense of transparency and auditability. This allows the results to remain. transparent and users to apply the information in alignment with their investment policies.
What is the basis for identifying the products/services with negative contributions?
The SDI AOP reviewed existing materials, in particular the UNEP Finance Initiative Sector Mappings, which are based on consultation with a broad range of stakeholders.
The Design Authority has applied this mapping in the context of its focus on products and services to derive its initial focus. The User Advisory Group has been surveyed to indicate priority issues and all high priority ones were included.
What does it mean if a product/service is classified as negative?
According to our methodology this product/service is not considered consistent with achieving the UN SDGs. We therefore expect a negative trend for these products with the delivery of the UN SDGs.

Can negative contributions be netted off against positive?
The SDI AOP does not believe that reflects the complexity and interrelatedness of the SDGs.
We have deliberately chosen not to provide net percentages as this could mask underlying activities. Transparency and credibility are core principles of our approach, which enable our community to take informed investment decisions.
We want to maintain the integrity of the SDI classification. We do not consider that entities with material negative contributions can also be classified as SDI, hence, we have extended the exclusions that we previously only applied for landfill and coal to all entities with >10% negative revenues. Users can apply different thresholds to the raw data if they require.
How are warning flags included in company assessments?
In the company assessments we assign warning flags to identify products and services which could have controversial operational activities associated with them. These consist of six types and include products or services in or to: large hydro or nuclear generation, palm oil production, biomass production from crops (corn or palm oil) to generate energy, mining and extraction of minerals and predatory lending.
Do financial services form part of the SDI classifications?
Some Development Banks have been classified as SDI, due to their lending being focused on delivering the SDGs in alignment with the taxonomy.
As of September 2023, Emerging Market Banks coverage has been added to the dataset. This type of data is notoriously difficult to find on the exposure of banks. The first area the SDI AOP is addressing is the assessment of the loanbook exposure of emerging market banks dedicated to serving micro, small and medium enterprise and underserved groups. This activity plays a critical role in the economic development of these countries.
We are continuing the dialogue with our user community about further options to enhance rules relating to financial services, taking into account the limited availability of consistent data which can facilitate differentiation.
As of December 2023, a new ‘development_bank’ classification type designed for a specific group of companies whose SDI assessment is centred around their lending’s alignment with the taxonomy has been introduced. This addition makes it effortless for SDI AOP subscribers to identify development banks.
Is Real Estate included in the universe?
Over the last three years, the SDI AOP has progressively expanded coverage across equities and fixed income. With September 2023 release, coverage is further enhanced with the addition of publicly listed Real Estate Investment Trusts (REITs). The initial data relates to social aspects, identifying those companies which are aligned to Healthcare (SDG 3) and Education (SDG 4). We have also updated our taxonomy guidance on energy/climate performance of real estate to reflect the development of the Carbon Risk Real Estate Moniror pathways, however this is not part of the data offering.
Does the SDI classification include the concept of additionality or provide geographical context?
Additionality of a company’s contribution to the SDGs and its geographical or social context is not explicitly part of the methodology yet. Real world outcomes and their context will be considered when further developing the SDI classification. Meanwhile, the geographical distribution of revenues is already considered in a few instances (e.g. telecommunication companies are assessed for the share of revenues from previously unconnected rural areas).
SDI Classification
Is there a plan to increase the coverage of products and services considered as solutions?
We expect to expand the current set of SDG solutions (products and services) with new or more effective solutions, which we will investigate following the research agenda. For example, we will continue to review topics such as biodiversity, circular economy, energy transition and access to finance to ensure we are reflecting the changes occurring and that we are capturing the full value chain where possible.
Does the SDI AOP provide tools that enable screening of portfolios or run benchmark comparisons?
The SDI AOP is being integrated into Axioma's Portfolio Construction and Risk Management tools to enable SDI screening, benchmarking, optimization, asset allocation and performance attribution. The data has been integrated into the Axioma Portfolio Optimizer and into Axioma Risk as of March 2023. The SDI Dashboard will be ready in early 2023.
How many companies are considered SDIs and how many companies are considered as negative?
In the December 2025 universe, 9,470 companies were assessed. 2,036 were identified as SDI of which 1,071 as majority (>50% of revenue is SDI) and 965 as decisive (>10%, <50% of revenue is SDI). Please note that majority plays contain 1,002 with higher confidence (confidence level 4, 5) and 69 lower confidence (confidence level 1, 2, 3). Of the decisive plays 626 companies were with higher confidence (confidence level 4, 5) and 339 lower confidence (confidence level 1, 2 ,3).
For the negative contribution, 558 companies were identified as majority negative (>50% of revenue is negative), of which 555 were with higher confidence (confidence level 4, 5), and 231 companies were identified as decisive negative (>10%, <50% of revenue is negative), of which 185 were with higher confidence (confidence level 4, 5).
Which companies are eligible to the research universe?
The SDI AOP research universe includes companies defined as separate legal entities with one or more financial instruments listed on a regulated public market. Eligible companies must publish financial statements and have identifiable economic activities. Currently, the SDI AOP covers major indices across equities and fixed income, including US, EU, High Yield, and Emerging Market bond issuers. Starting from September 2023, coverage has been enhanced with the addition of publicly listed Real Estate Investment Trusts (REITs), focusing initially on aspects related to Healthcare (SDG 3), Education (SDG 4), Forestry (SDG15). Future expansions have included fixed income coverage for EU and US corporate investment-grade bonds since December 2021, High Yield Bond issuers since December 2022, and Emerging Markets as of March 2023.
SDIs are either classified as Decisive and Majority players. What does this mean?
When >50% of revenues are from products and services that contribute positively to the SDGs the company is classified as Majority player. When that percentage is between 10% and 50% the company is classified as a Decisive player. Below 10% is considered as non-SDI. If a company has a negative percentage of > 10, it cannot be classified as SDI.
When will a company be excluded from SDI classification?
Once a company is eligible for inclusion in the SDI universe, it will be picked up in the SDI classification pipeline. The SDI classification is based on publicly disclosed company information. During the classification process, data extraction needs to be performed, before the actual classification steps can be applied, no matter if the classification is formula-based or revenue-based. Yet, for a very small number of companies, data extraction cannot be successfully completed, because the information required for classification is not sufficiently disclosed. In these cases, a company may be excluded from delivery. The total number of such companies is currently not higher than a few dozen.
How can I access the SDI data?
The data is available to Qontigo SDI AOP subscribers in PSV file format and distributed via a secure SFTP site of our global distributor Qontigo. It is also available to SDI AOP clients via Aladdin® (a BlackRock technology platform), as well as Aladdin Risk. BlackRock’s Aladdin platform is a financial technology platform designed for institutional use only and is not intended for end investor use.
Would you like to learn more about our services or sign up as a subscriber? Get in touch with our distribution partner Qontigo.
What is the Release Schedule of datasets?
We maintain a quarterly release schedule to ensure the SDI dataset reflects changes in index constituents and incorporates the latest annual reporting. See below for a summary of the release schedule:

Will the data access be compatible with other systems typically used in financial institutions?
Our global distributor ISS STOXX is committed to open access to the data. The data will be made available in the distribution partner’s product set, as a separate data deliverable, and will work with other data redistributors to make the data available in other systems.
How much historical data is available for the SDI Classification dataset?
Data is available from 2019.
How does the process manage the potential of greenwashing (bias) in input data?
By focusing on products & services and financial data, the process is fact-based and allows for full transparency (the full process is rules-based and auditable). Furthermore, a combination of artificial intelligence combined with human intelligence that is used to ensure correctness is leveraged. After classification of a company, there is also human validation of the company classification. The SDI classification does not consider any self-classification by a company of alignment with the UN SDGs as this would not necessarily be consistent with the SDI Taxonomy.
Do you have functionality to run customized reports?
Currently data will be provided to enable subscribers to load into its own database. SDI Dashboarding capabilities will be available in early 2023 and will include the following functionalities:
- Access via an Axioma Cloud Native platform
- Ability to multiple portfolios with a common identifier, market cap and weights
- Automatic mapping of instruments to the SDI Universe
- Portfolio level aggregation
- Ability to slice and dice for different SDI views (country, sector, SDGs)
- Download via excel/pdf
How can the SDI data be used in the context of regulatory reporting frameworks?
The SDI AOP data set is often used as an input into regulatory reporting, due to its alignment with the key Regulatory Frameworks. For example, the SDI taxonomy and the EU taxonomy, largely connect at the level of objectives (for climate mitigation and adaptation) as well as the use of thresholds and conditions. While developing the SDI standard we used the EU and other taxonomies as a reference to inform our efforts.
We would note that the SDI AOP is a global asset owner defined standard, hence, is not driven by regional or political influences. Additionally, within the SDI AOP data set, negative contributions data and operational risk warning flags can be used to identify significant negative impacts on the UN SDGs.
The SDI Dashboarding capabilities have been launched in 2023 and will allow subscribers to run customized reports.
Is it possible to request set of companies to be included as part of the SDI Universe?
The Design Authority is responsible for defining the SDI AOP research universe. A new index or a group of custom companies can only be added to the universe with the approval of the Design Authority. The DA welcomes feedback on priorities for enhanced coverage.
Does the classification include the concept of additionality or provide geographical context?
Additionality of a company’s contribution to the SDGs and its geographical or social context is not explicitly part of the methodology yet. Real world outcomes and their context will be considered when further developing the SDI classification. This obviously is a major challenge which we’ll take on with a limited number of SDGs and sectors/companies. Meanwhile, the geographical distribution of revenues is already considered in a few instances (e.g. telecommunication companies are assessed for the share of revenues from previously unconnected rural areas).
SDI Outcomes
What is the SDI Outcomes product?
The SDI Outcomes product is a scalable solution that provides consistent, granular data on sustainability outputs and outcomes across a portfolio of listed companies. It includes metrics like avoided emissions and the number of people served, along with geographic and product/service details.
Why was the SDI Outcomes product developed?

Why is it called "Outcomes"?
The term "Outcomes" reflects the product's focus on tangible, measurable results in the real world like avoided emissions and the number of people served. This reflects discussions with investors and organisations active in this area such as GIIN and UNPRI and is a conscious decision to not label the product as measuring impact, which would be a step further in the process.
How is SDI Outcomes related to the other SDI products (SDI Classification, SDI Innovation Outlook and SDI Private Markets)?
SDI Outcomes builds upon the foundation of the SDI taxonomy, which underlies the other products as well. The SDI Asset Owner Platform (SDI AOP) begins with revenue data linked to a company’s products and services to determine SDI qualification. SDI Outcomes enhances this approach by introducing new metrics that deliver consistent and granular data on the sustainability outputs and outcomes underlying the SDI classification of revenues. Through the lens of the SDI taxonomy, SDI Outcomes provides a robust tool and methodology to support transparency, improve reporting, and address greenwashing concerns, complementing the existing SDI product suite.
What principles guided the outcomes product design?

What type of data does the SDI Outcomes product provide, and how is it generated?
The SDI Outcomes product delivers a comprehensive data set comprising:
- Outputs Layer: Quantifies sustainable products and services.
- Outcomes Layer: Reports avoided emissions and people served.
- Geographic Layer: Highlights exposure to specific regions, such as emerging markets
The data is generated using company revenue and production figures, further enhanced by market pricing, industry benchmarks, and scientific methodologies. This approach aligns with globally recognized standards such as WBCSD, GIIN IRIS+, PCAF, ICMA and others, ensuring robust and credible outputs. Each outcomes datapoint indicates the inputs that went into calculating it.
Does the product use company reported avoided emissions or people served data?
The product utilizes company reported data on outputs (i.e. quantities of products or services) to inform the calculations where available. This is useful to ensure it reflects the company information on its own products. In developing the product it became clear that the avoided emissions data is not widely available and companies use a range of assumptions in producing numbers. We therefore have standardized the calculation methodology to ensure users can compare and amalgamate data. This means that each company datapoint does not have to be reconciled and validated by the user for consistency. The same approach is applied to people served as even metrics which appear relatively simple such as ‘people supplied with water’ are using different metrics and assumptions to calculate the numbers.
How reliable is the data, and what makes the methodology credible?
The data provided by SDI Outcomes is validated against corporate disclosures, scientific research, and market benchmarks. This rigorous validation process ensures both accuracy and consistency. The methodology underpinning SDI Outcomes further enhances its credibility, having been reviewed and endorsed by leading asset owners and industry experts. It aligns with global best practices, minimizing risks of overclaiming or greenwashing while maintaining transparency and methodological rigor. The confidence level of the outputs data is also indicated in the dataset so that users can understand where we are using a directly reported number and where we have derived the number from a related datapoint. For example, whether we are using a reported amount sold of a product or using the commodity price to convert the revenues into the amount. We will continue to review the data and methodologies over time to ensure enhancements are fed into the system.
Does the SDI Outcomes data cover negative contributions?
Most users of the negative data use it to avoid exposure, therefore it has not been a priority to quantify the amount of negative outputs or outcomes. As indicated in relation to the SDI Classification of revenues we also do not recommend netting off of negative and positive contributions. For avoided emissions this also reflects the WBCSD and GHG Protocol guidance that Scope 1,2&3 emissions reported under GHG Accounting should not be combined with Avoided Emissions numbers.
How can the outcomes data support investment strategies?
It enables users to:
- Address specific SDG targets, such as infectious diseases in healthcare (SDG 3.3).
- Identify companies contributing to climate solutions, such as renewable energy in emerging markets.
- Develop focused strategies by filtering data based on geographic or product/service specifics.
Can the data be used for reporting?
The data supports portfolio-level reporting of sustainability outcomes, such as:
- Portfolio-wide avoided emissions.
- Number of people served.
How does it help address greenwashing concerns?
By building step by step on audited revenue and production numbers using a conservative and transparent calculation approach, the product ensures accurate representation of real-world outcomes, verified against credible standards.
Can SDI Outcomes support net zero strategies?
The product quantifies avoided emissions, indicating the relative contributions of companies towards net zero goals and identifying opportunities to maximise exposure to solutions.
How can companies utilize geographic data in investment planning?
The geographic layer allows users to identify specific markets, like emerging economies, and direct investments towards regions that align with their strategic objectives.
Can the data be integrated into existing portfolio management software?
The data can be linked to entities using the usual identification mapping that is used in the market and is available across the SDI Products subject to the relevant licenses. SDI products always provides raw data to enable users to ingest data into their own systems and apply their own preferences and policies.
Who can I contact for information about pricing and subscriptions?
For an in-depth presentation or further insights, please connect with the SDI AOP team directly at info@sdi-aop.org. For questions related to subscriptions, our global distributor, ISS STOXX, serves as the first line of support and manages all commercial aspects of the product. You can reach them at sdiaop@iss-stoxx.com.
SDI Private Markets Membership
Why did the Sustainable Development Investments Asset Owner Platform (SDI AOP) introduce the SDI Private Markets Membership?
In keeping with the mission of accelerating investments to deliver on the Sustainable Development Goals, thereby supporting investment outcomes for end beneficiaries, the ability to consistently measure contributions across asset classes is essential.
After having built a coverage universe of over 10,000 companies that have issued public market instruments, SDI AOP has now started to make its classification structure available for private market investment classification.
To support and advance the classification of private market investments, the SDI AOP is offering membership to its private market service. This is separate from the pre-existing data subscription for public market data.
Why is the SDI Private Markets Membership important?
Private market assets are typically diverse and lack public transparency, making it difficult to measure their contributions to SDGs. At the same time, due to nature of these assets they are likely to offer targeted exposures that contribute to the SDGs. As most private market investments also tend to be held for a relatively long period of time (this particularly holds true for real assets), the relevance of measuring these assets is obvious. The SDI Private Markets Membership provides a structured approach to overcome measurement challenges, aligning the classification of contributions of private investments with public market standards.
Why is it so difficult to measure the SDG contribution of private markets investments?
Whereas public market assets are held by many investors and have benchmarks with transparency on constituents, private market assets lack these features. It implies that portfolios are very diverse and may not overlap extensively. Moreover, information on proprietary investments is typically held confidentially, so that there is no data source the SDI AOP can rely on to extract the information necessary for classification. This therefore requires a different approach and was the reason for the SDI AOP to develop the SDI Private Markets Membership including the SDI Private Markets Tool and Templates
What is included in the SDI Private Markets Membership?
SDI Private Markets membership offers several key benefits:
- Access to the SDI Community: Opportunities to interact with peer investors, share best practices, and discuss use cases.
- Access to the SDI Private Markets Tool: A template to self-classify or include previously classified investments, and to report portfolio summaries.
- Support: Members receive ongoing support, including regular updates to rules and functionalities to ensure consistency across private market assets, and the ability to engage with SDI AOP for developing further guidance.
What is the SDI Private Markets Tool and template?
The SDI Private Markets Tool and template is designed to help users robustly and consistently classify their private market investments. It is based on precedents set by founding organizations and will be continuously developed based on member feedback. The tool assumes investors to enter their own (confidential) information and does not require handing over information to SDI-AOP
How is the tool developed and in which format will it be offered?
The Design Authority organizations involved in the SDI AOP (APG, AustralianSuper, BCI and PGGM) have already been classifying private market assets for some time now and have built precedents on how they have implemented this for their portfolios. Together with the SDI taxonomy this forms the basis for the SDI Private Markets Tool, which is aimed to guide users to classify their private market investments robustly and consistent with the public market classification approach.
The tool has been built using Microsoft Excel. This both has the advantage of most people being able to work with it and it is a stand-alone environment which does not require information of a confidential nature to be shared with SDI AOP (which would be the case when using an online portal). The Excel tool draws from the SDI Taxonomy and classification as oriented at providing an environment to classify private market investments efficiently. To facilitate this, the Tool uses a combination of macros and VBA coding to generate the necessary information on product categories and products classified.
Which asset classes are covered in the SDI Private Market Tool & Template?
The SDI Private Markets Tool provides a consistent approach to measure the portfolio aligned with the public market coverage. The investment classes within the tool include non-listed investments in
- real estate
- infrastructure
- private equity
- private debt
Other assets (e.g. hedge funds) may be added in future releases. Functionality is being developed based on member feedback.
Does the SDI Private Markets Tool include any pre-existing data?
No, the SDI Private Markets Tool does not include any pre-existing data. Private markets data is typically held confidentially, and there is no centralized data source that the SDI AOP can rely on to extract the necessary information for classification. The tool is designed for users to self-classify their private market investments or include investments that have been classified before.
In what frequency are new releases available?
The SDI Classification data for public markets has quarterly releases to reflect changes in index constituents and to incorporate the most up to date annual reporting. Even though there is no established benchmark to adhere to, the SDI Private Markets Tool & Template will also be released on a quarterly basis, so it ensures consistency with the public markets data. This particularly pertains to adjustments to classification rules, the addition of product categories and the addition of functionality. The SDI Private Markets is released one month after the public markets data releases.
Can I influence the development of the tool e.g. share any comments?
As part of the SDI Private Market Membership, you not only get access to the Tool & Templates, but you will also become part of the SDI Private Markets community. There will be regular online or in-person community meetings to share knowledge and dilemma’s on measuring private market contributions to the SDG’s. Based on the feedback of the subscribers in the community the SDI Private Markets Tool & Template will be further developed.
What are the benefits of joining the SDI Community?
Joining the SDI Community allows members to network with other subscribers, share insights and best practices, and collaborate on developing and refining the SDI framework for private markets.
How does SDI AOP ensure the confidentiality of proprietary investment data?
SDI AOP recognizes the importance of confidentiality in private market investments. The membership and tools are designed to respect the proprietary nature of investment data, ensuring that sensitive information is handled with the utmost care and security. Because of the offline nature of the tool, no exchange of information from the users to SDI AOP is required.
What support does SDI AOP provide to members?
Members receive ongoing support, including regular updates to rules and functionalities to ensure consistency across private market assets, and the ability to engage with SDI AOP for developing further guidance.
Who can apply for membership?
Subject to Board approval of the Board of the SDI AOP Membership is available to:
- Institutional investors (e.g., pension funds, insurance companies)
- Associate members (organizations interested in SDI),
- Issuer members (companies evaluating and self-classifying their investments)
How can I apply for membership?
You can apply for membership by completing the online membership application form. In case of any questions or requiring a demo you can reach out to private-markets@sdi-aop.org.
How many companies are screened on their contribution to the UN SDGs?
The SDI Asset Owner Platform (SDI AOP) aims to provide a comprehensive coverage of global institutional investors’ portfolios for their contribution to the Sustainable Development Goals. To this end the SDI AOP has defined a universe which broadly encompasses the global capital markets portfolios of a large institutional investor and will be adjusted from time to time. In September 2024 we classified 9,917 entities issuing publicly traded securities.
Are Private Markets included in the SDI Classification?
In keeping with the mission of accelerating investments to deliver on the Sustainable Development Goals we want to capture contributions in all asset classes.
Whereas public market assets are held by many investors and have benchmarks with transparency on constituents, private market assets lack these features. It implies that portfolios are very diverse and may not overlap extensively. Moreover, information on proprietary investments is typically held confidentially, so that there is no data source the SDI AOP can rely on to extract the information necessary for classification. This therefore requires a different approach to enable users to start measuring their private market investments. In April 2024 the SDI Private Markets Membership was launched. Offering a template and tools to guide users to classify their private market investments robustly and consistent with the public market classification approach.