


Qontigo whitepaper: Identifying outperformance with the SDI Innovation Outlook Score
In December 2022 we introduced a new, forward-looking metric called the SDI Innovation Outlook. SDI Innovation Outlook analyzes more than 20 million patents from thousands of companies, providing a unique picture of their future positioning in 130 technology themes that have been identified to advance the SDGs. An SDI Innovation Outlook score is given to companies based on patents issued in the previous ten years that contribute positively to SDGs according to the SDI classification.
Robert A. Stubbs, PhD, Senior Principal for Incubation at Qontigo, investigates the effectiveness of the SDI Innovation Outlook score in predicting equity returns and enabling the construction of outperforming portfolios. The findings show that the score can be used as a signal to generate outperformance in portfolio returns.
Methodology
An extensive history of the SDI Innovation Outlook score is not available, so Robert uses a rolling SDI 3-year Outlook (3YO) score as a proxy. The 3YO is based on the same processing of patents as the full SDI Innovation Outlook score, but only considers patents issued in the last three years and does not consider patent citations. The full SDI Innovation Outlook score is therefore an extension of the shorter-term 3YO score employed in this research.
The author reviews the information contained in the 3YO score by considering both the information coefficient (IC)3 of the signal at different horizons and the information ratios of long-only portfolios constructed to maximize exposure to the signal. He then tests both measures of information over three different regions: US, Europe, and APAC. Each region is further broken down by market capitalization buckets.
The study first determines that the ICs found in the SDI scores do appear to contain information in predicting equity asset returns above and beyond that which can be explained by risk factors. Not surprisingly, the coefficients tend to increase in strength as the horizon increases. This is consistent with the belief that it takes time for patents to translate into financial success and increase the market value of a firm’s equity.
Returns
Importantly, the author illustrates how the active portfolios, constructed using the 3YO score and with a factor-neutral optimization, outperformed their benchmarks from 2014 to 2022 (Exhibit 1). To do this, Robert considers a simple strategy that maximizes the 3YO score subject to having predicted tracking error to an underlying benchmark of at most one percent and having zero active exposures to all risk factors in the Axioma medium-horizon fundamental risk model for the corresponding region. In some cases, the outperformance is statistically significant.
Exhibit 1 – Annualized total returns of optimized SDI strategies
Source: "Outperformance with SDI Outlook Score", Qontigo, February 2023 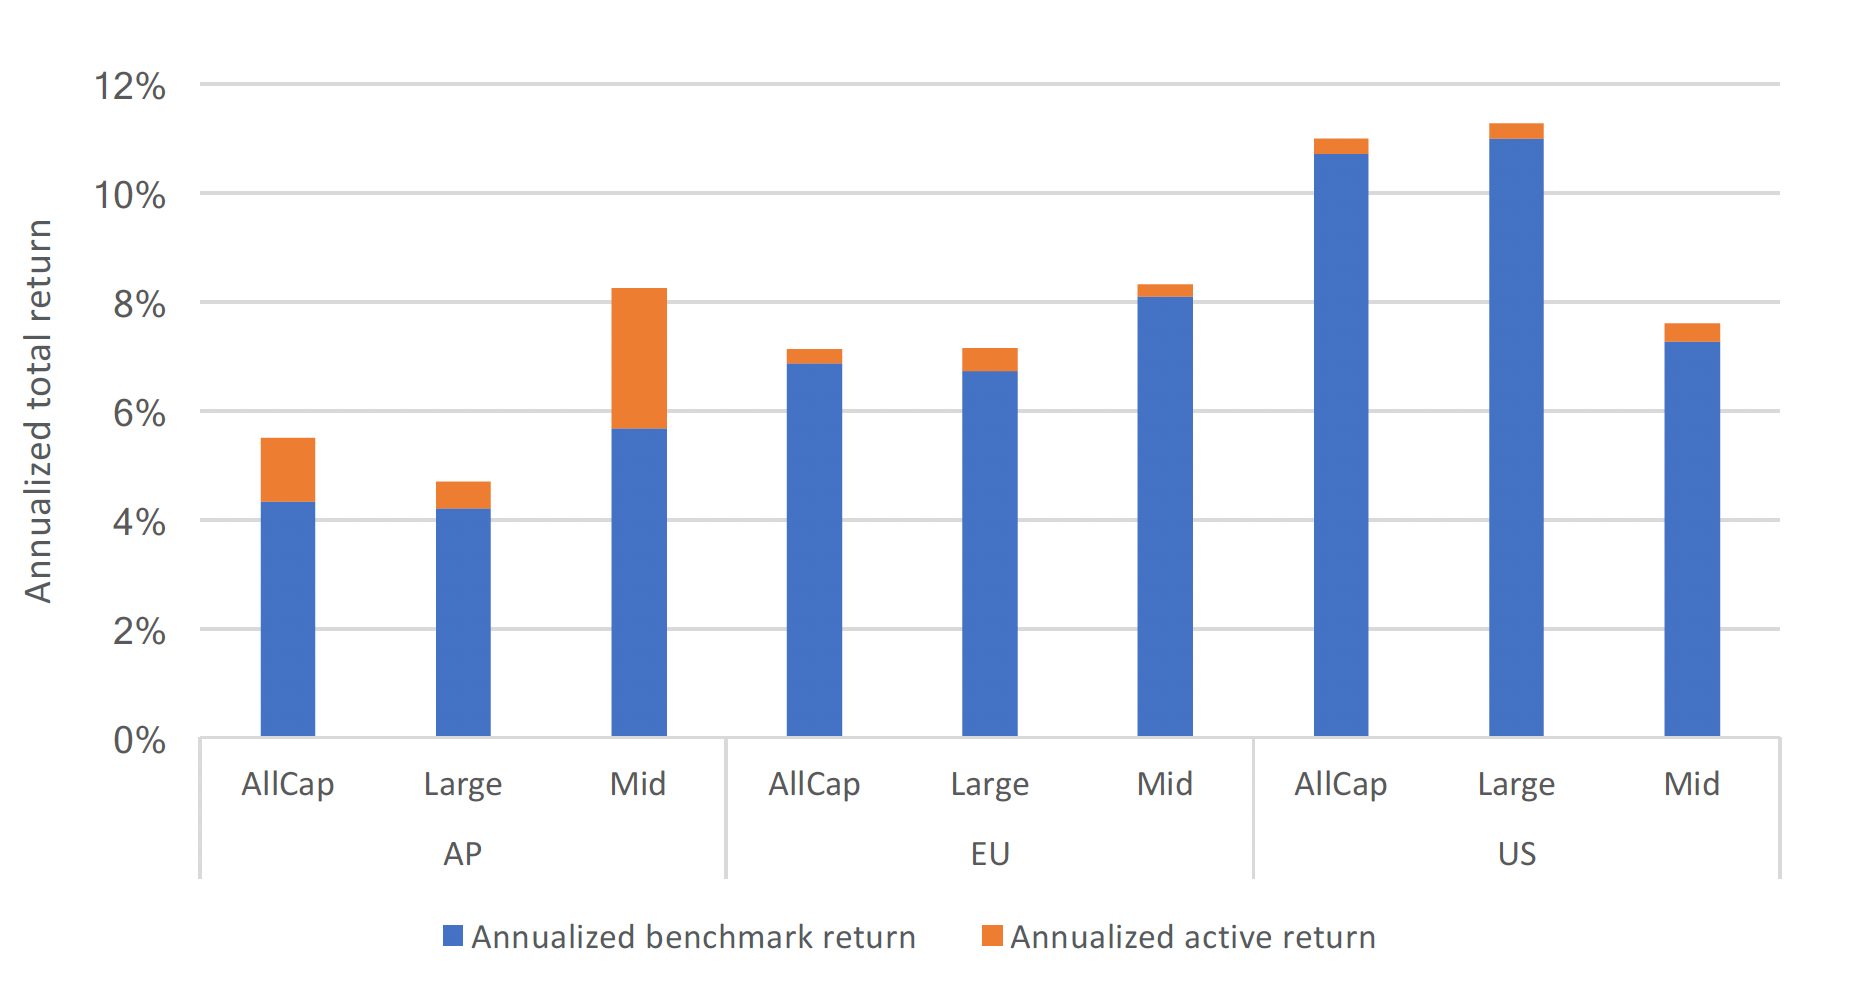
Robert runs a second back-testing scenario where the portfolios don’t invest in individual equities, but rather into five synthetically created ‘ETFs’, each made up of sets of assets organized according to their label of patent exposure: Unclassified, Ineligible, Adopter, Developer and Innovator. In this case, all segments showed outperformance for the active strategies over the entire backtest period since 2014.
“The consistency of the relative performance across both market-cap segment and region further validates our hypothesis that the 3YO score contains information in predicting future asset returns and thus may be a true alpha-generating signal,” writes Robert.
We invite you to download and read the whitepaper here.
